*The number of shares held includes share that have been allotted to employee pension trusts.
*Treasury stock has been excluded from the calculation of the ownership ratio.
Composition of Shareholders
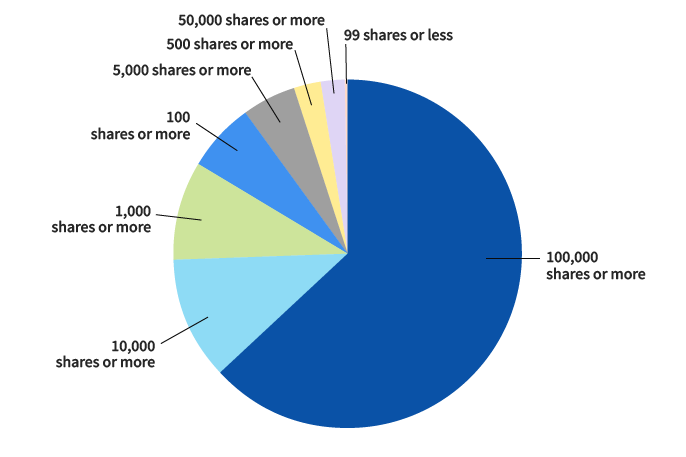
By Number of Shares Held
(As of March 31, 2025)
100,000 shares or more
9 shareholders
5,586,266 shares
63.05%
50,000 shares or more
3 shareholders
192,674 shares
2.17%
10,000 shares or more
55 shareholders
1,029,943 shares
11.62%
5,000 shares or more
68 shareholders
451,441 shares
5.09%
1,000 shares or more
436 shareholders
796,363 shares
8.99%
500 shares or more
385 shareholders
229,392 shares
2.59%
100 shares or more
3,703 shareholders
562,931 shares
6.35%
99 shares or less
1,135 shareholders
11,552 shares
0.13%
Total
5,794 shareholders
8,860,562 shares
100.00%
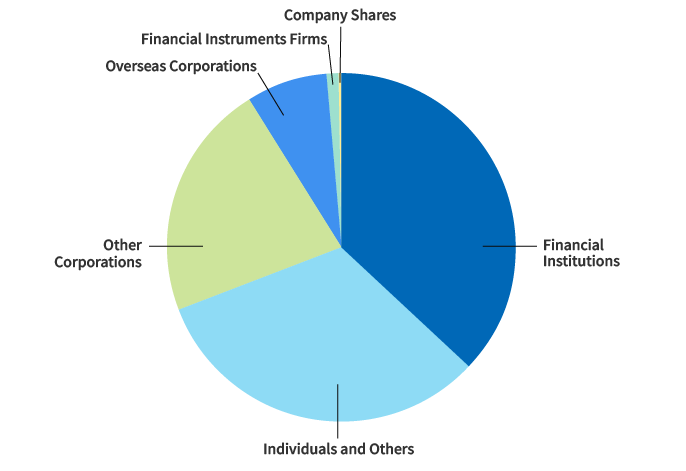
By Type of Shareholders
(As of March 31, 2025)
Financial institutions
19 shareholders
3,289,939 shares
37.13%
Financial instruments firms
31 shareholders
97,774 shares
1.10%
Other corporations
275 shareholders
1,942,347 shares
21.92%
Overseas corporations
89 shareholders
684,363 shares
7.72%
Individuals and others
5,379 shareholders
2,840,988 shares
32.06%
Company Shares
1 shareholders
5,151 shares
0.06%
Total
5,794 shareholders
8,860,562 shares
100.00%
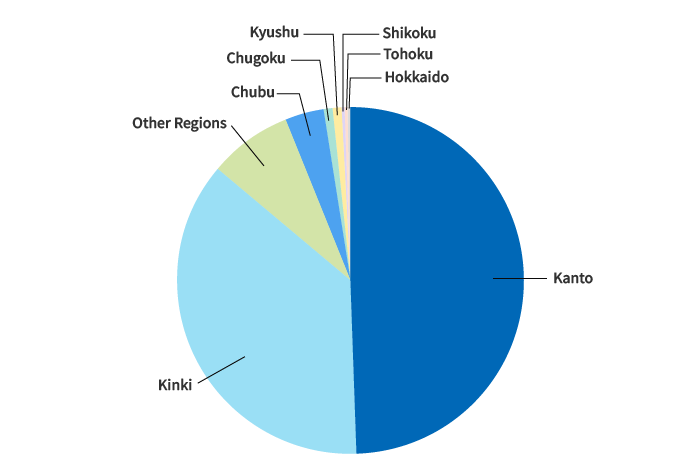
By Region
(As of March 31, 2025)
Hokkaido
85 shareholders
16,792 shares
0.19%
Tohoku
122 shareholders
19,509 shares
0.22%
Kanto
2,309 shareholders
4,396,821 shares
49.62%
Chubu
791 shareholders
340,316 shares
3.84%
Kinki
1,698 shareholders
3,235,615 shares
36.52%
Chugoku
263 shareholders
73,405 shares
0.83%
Shikoku
153 shareholders
23,600 shares
0.27%
Kyushu
285 shareholders
65,561 shares
0.74%
Other regions
88 shareholders
688,943 shares
7.78%
Total
5,794 shareholders
8,860,562 shares
100.00%
Stock Prices and Turnover for Past Five Years
Fiscal term
103th
104th
105th
106th
107th
Fiscal year ended
March 31, 2021
March 31, 2022
March 31, 2023
March 31, 2024
March 31, 2025
Prices (at fiscal year-end) (yen)
2,251
3,560
5,800
7,220
1,914
Highest price (yen)
2,440
4,005
6,380
7,430
2,090
Lowest price (yen)
1,507
2,103
3,225
5,210
1,513
*The highest and lowest prices shown above were stock prices traded on the Prime Market of Tokyo Stock Exchange.
*Since the 107th fiscal year, shares have been split into three, and accordingly, the share price has been reduced to one-third.